16/05/2026
Blogs
5 Key Metrics to Track in Solar PV Monitoring System
5 Key Metrics to Track in Solar PV Monitoring System
.png)
India is not what you assume anymore. The country is becoming a silent superpower with technology, business, innovation, etc. Notably, one of the most praised parameters the country is currently operating on is the sustainability commitment. India has committed the following targets as sustainability goals:
-
500 GW Non-Fossil Capacity: Target for 2030.
-
50% Energy Needs from Renewables: By 2030.
This means India is a booming market for Solar PV, with homes and businesses installing PV systems to cut electricity bills and go green. But what most people don't know is that they might be losing up to 20-30% of their energy output due to dirt, faults, or weather issues.
Now the question is how to measure Solar PV to maintain the maximum energy output for homes and businesses.
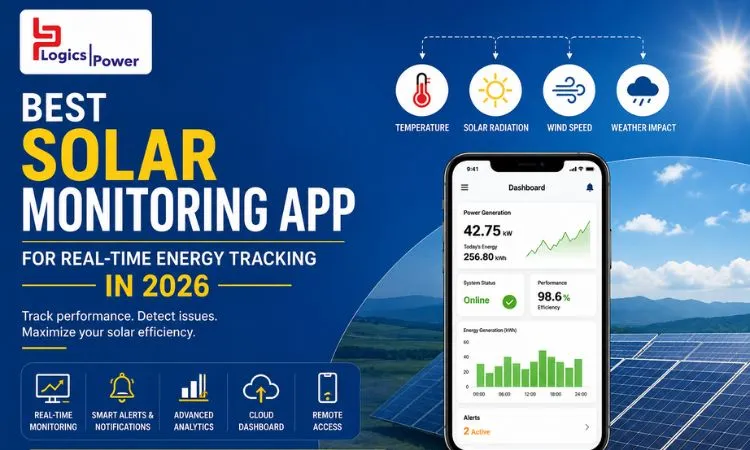
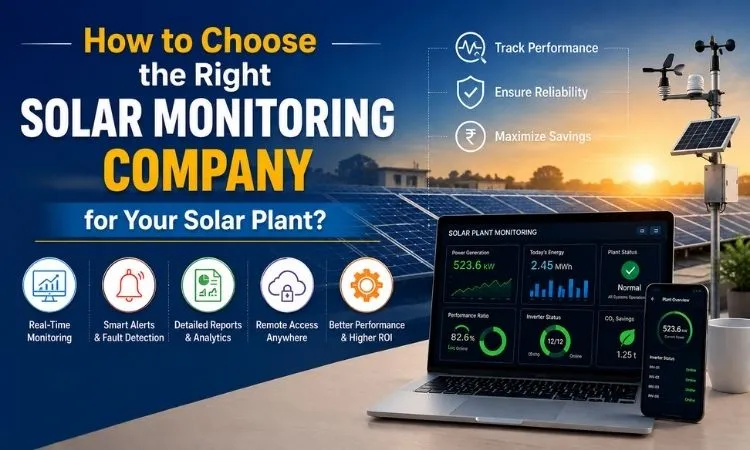
Here's the simple solution- utilising tools like Power AMR Solar PV Monitoring System helps spot problems early, boosts efficiency, and maximises your results.
Why Monitor Solar PV Systems?
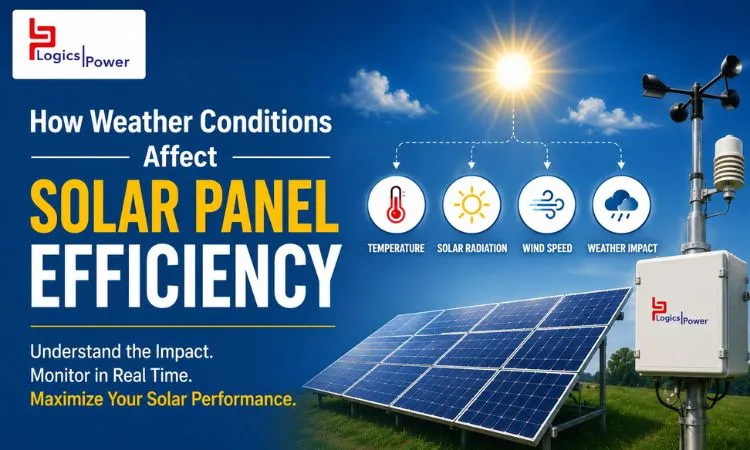
A good Solar PV monitoring system offers you real-time data on your panel, inverters, and overall performance. This is essential in a country like India, where dust and heat directly affect your solar output. What does it mean?
A simple act of monitoring your Solar PV output saves more than 20% of your energy and electricity bills, and saves the environment.
With a Solar PV monitoring system, all the monitoring process becomes simple with mobile alerts and dashboards. This ensures that your system always runs at peak, saving money on repairs and down time.
There are several Key Metrics that tell you if everything is working fine or not. The best thing is that you always get an alert when it's time for a check.
Metric 1: Performance Ratio (PR)
Understand this: there are two conditions a machine operates on. The first one is ideal when the machine generates maximum output. The second is the real operational conditions, showing dampers and losses.
Performance Ratio is a metric that shows how well your system performs compared to ideal conditions. It is actual energy output divided by expected output, after losses from heat, dirt, or shading.
This is the actual energy available after the deduction of the energy loss.
Here are some notes for you:
Healthy Performance Ratio stays between 75-85%. If you see the ratings below 75%, this means you should check for inverter faults or dirty panels.
Formula:
PR = (Actual kWh / (Peak kWp x Sunshine Hours)) x 100.
With a Solar PV Monitoring system tool, you can get instant PR alerts about fixing issues before the cut the production. Search measurements help you detect small problems early, keeping your Solar Plant reliable throughout the year.
Metric 2: Specific Yield
Specific yield (kWh/kWp) is the energy (kWh) generated per kWp module capacity over time. In other words, this metric lets you measure the full equivalent hours a plant produced during a specific time frame.
Since it lets you measure the time, the metric helps you compare sites fairly and ignore system size.
Formula:
Daily Specific Yield (kWh/kWp)= Daily Energy / DC Capacity
For example, If a 5 kW DC Capacity plant produces 21 kWh on a particular day, its Specific Yield for that particular day = 21/5 = 4.2 kWh/kWp
Tracking the Specific Yield detects the best performance of Solar PV, helping you to choose.
Note-
The average expected Indian Specific Yield is 1,200-1,800 kWh/kWp yearly. Rajasthan gets higher because they get more sunlight.
Region Expected Specific Yield (kWh/kWp)
-
Rajasthan- 1,600-1,800
-
Tamil Nadu- 1,400-1,600
-
Uttar Pradesh- 1,300-1,500
Metric 3: System Efficiency
System efficiency stands for the percentage of sunlight that is turned into electricity by the Solar PV Models. The usual average efficiency is 15-22% for modern panels. It drops gradually over time due to degradation.
Note- the average degradation is 0.5-1% per year.
But here is what you must know-
-
Look for sudden falls that signal a hotspot or loose connections.
-
Measure that with temperature data since high heat lowers efficiency.
-
Clean your panels monthly and use thermal cameras for keeping it at maximum.
-
Use sensors to integrate this data for easy monitoring and maintaining top efficiency in all weathers.
Metric 4: Energy Output (kWh)
Energy output is the energy generated for use. This metric tracks the total KWh of energy generated on a given period of time - daily, monthly, or yearly. This is your system’s main results, which gives a direct indication of the energy produced.
What you need to know:
-
Compare your energy production against the weather forecasts. The shortfalls mean grid issues or panel faults.
-
Use historical data to predict bills and measure ROI.
-
Look for brands like PowerAMR for trending charts for seasonal patterns, like monsoon dips, for better planning.
Metric 5: Capture Losses/PRAGMA
Finally, look for the Capture Losses metric. Capture Losses count all the times when production was stopped. For example, inverter trips, faulty trackers, AC issues or grid outages. These are very common situations and often affect the power output significantly. However, aim for only 2% of Capture Losses. Getting Solar PV monitoring advanced tools spot these losses fast, cutting downtime by 10-15%.
Conclusion:
Solar PV monitoring is essential in tracking the power output and minimising faults. This helps manufacturing units and brands leverage the maximum power, resulting in the best outputs. But the question is - how to monitor the power out and performance? Monitor these 5 metrics:
-
Performance Ratio
-
Specific Yield
-
System Efficiency
-
Energy Output
-
Capture Losses/PRAGMA
These metrics track the production percentage and losses, offering opportunities to lift your solar uptime and extend panel life. Want to install and leverage the customized Solar PV Monitoring System for your units? Visit Power AMR today.
Follow Us
Contact Us